graphic-art, print, engraving
#
graphic-art
#
dutch-golden-age
# print
#
engraving
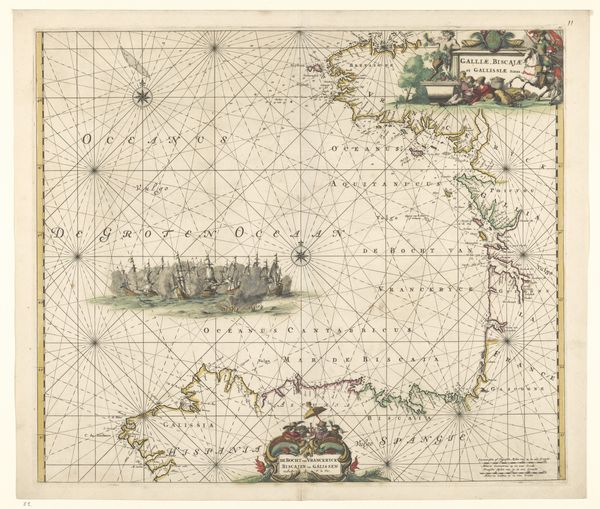
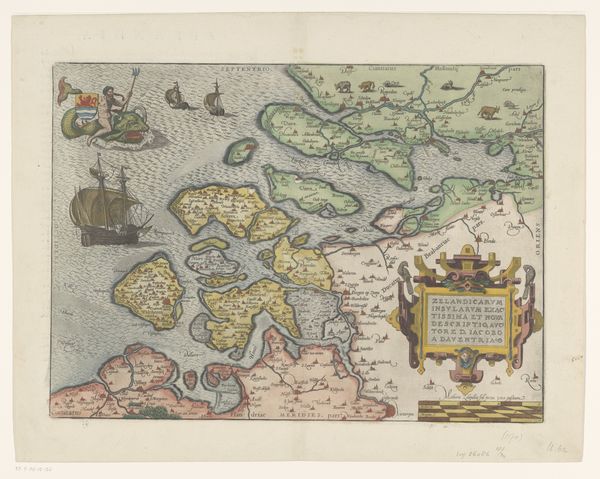
Dimensions: height 443 mm, width 548 mm
Copyright: Rijks Museum: Open Domain
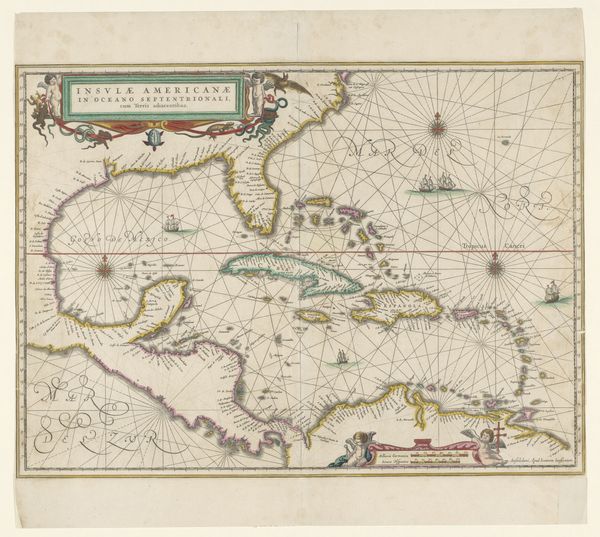
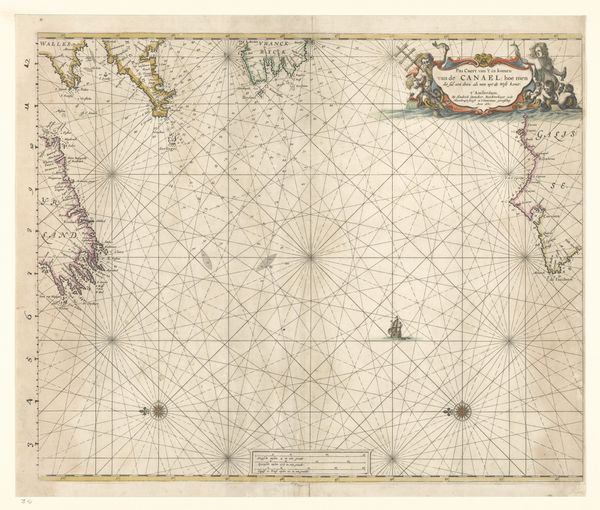
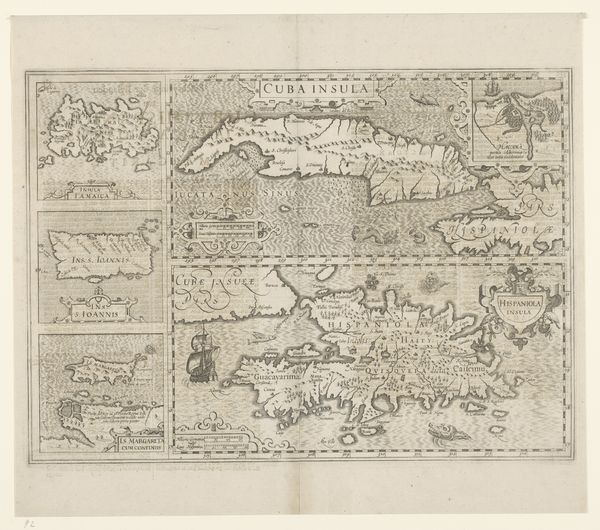
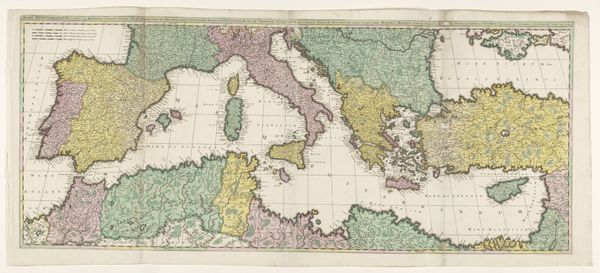
Curator: Editor: This is “Zeekaart van de Oostzee,” a sea chart of the Baltic Sea created in 1673 by Gerard Coeck, rendered in graphic art using engraving. I'm struck by the meticulous detail. How would you approach it? Curator: We need to think about the context of this chart. The Dutch Golden Age was defined by global trade, with cartography as both a product and driver of this economic expansion. Look closely. The quality of the engraving itself signifies value and authority. It isn’t just information; it’s a commodity. Editor: So you’re saying that the map is less about objective geographic truth, and more about the Dutch asserting dominance through material means? What about the artistry, the decorative elements like the coat-of-arms and figures with instruments? Curator: Exactly! The decorative elements are integral to the chart’s function. They signal wealth, knowledge, and control of resources. Consider the labor involved: from surveying the waters to engraving the plate, and the distribution of this map, it’s a network of power materialized. The artistry serves a practical purpose to add value to this commodity, while portraying Dutch prowess. Editor: That’s fascinating, reframing the chart as a physical embodiment of economic and political ambitions. Curator: Indeed. By understanding its production and use, we understand how this "Zeekaart van de Oostzee" participated in shaping global trade dynamics of its time. It shows not just the sea, but Dutch colonial desire solidified onto paper. Editor: It does make you consider how something like a map has its own politics built in! Thanks, I’m going to look at maps much differently from now on.
Comments
No comments
Be the first to comment and join the conversation on the ultimate creative platform.
More like this