graphic-art, lithograph, print
#
graphic-art
#
lithograph
# print
#
landscape
#
geometric
#
romanticism
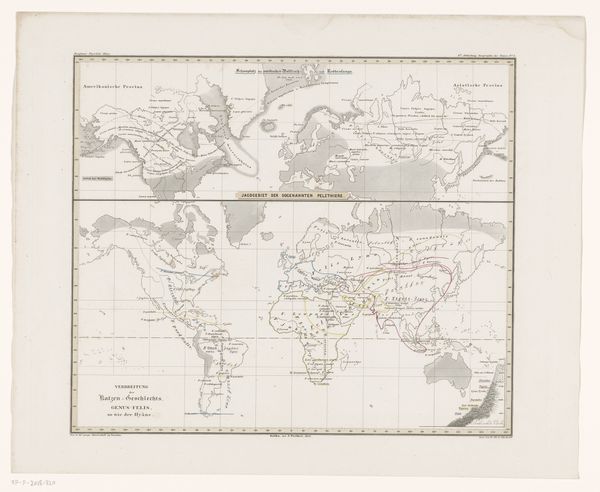
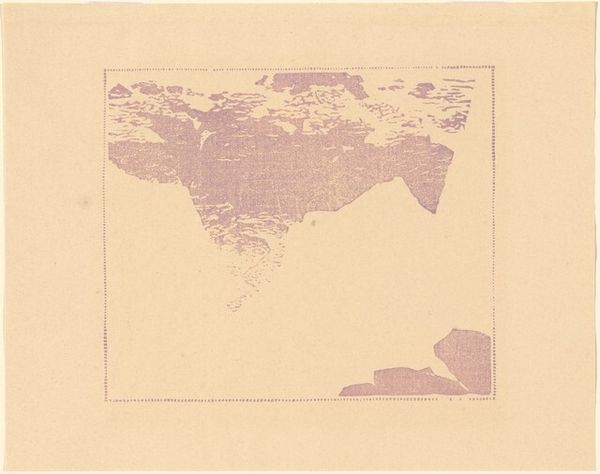
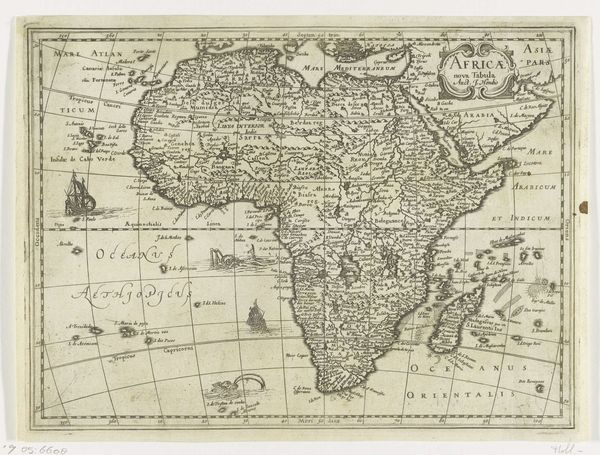
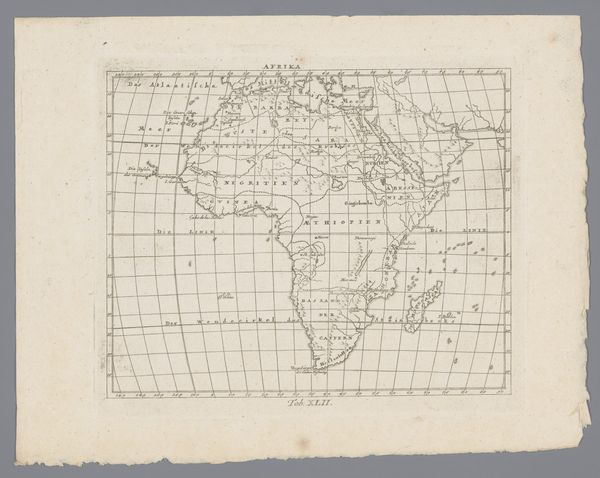
Dimensions: height 349 mm, width 430 mm
Copyright: Rijks Museum: Open Domain
This "Wereldkaart met de dichtheid van roofdieren per gebied" or world map of predator density, was made anonymously, and depicts the geographic distribution of carnivorous animals. This map isn’t just about geography. It silently speaks to the history of colonialism, reflecting how Western powers categorized and viewed the world through a lens that prioritized control and resource extraction. What does it mean to map predators? Who is defining what is a predator, and for what purpose? Look at how the map is centered; it subtly emphasizes certain regions while marginalizing others. Consider the emotional implications of such categorization. While this map presents an ostensibly objective view, it is laden with cultural and historical context that invite us to question the power dynamics inherent in how we perceive and interact with our environment. It reminds us that even scientific representations are steeped in human intentions and cultural narratives.
Comments
No comments
Be the first to comment and join the conversation on the ultimate creative platform.
More like this