Dimensions: image: 18.8 x 23.2 cm (7 3/8 x 9 1/8 in.)
Copyright: CC0 1.0
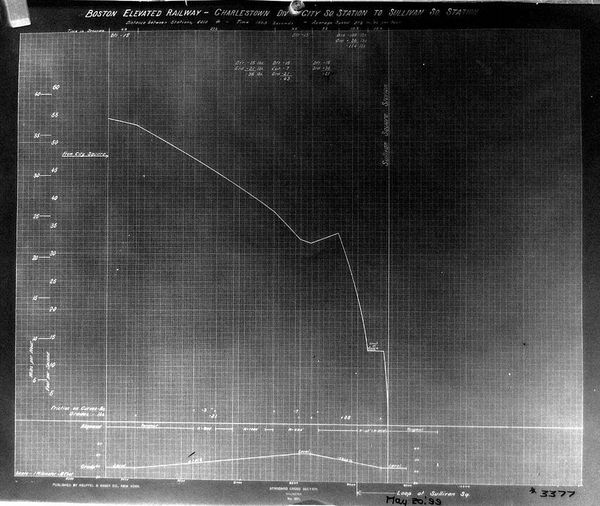
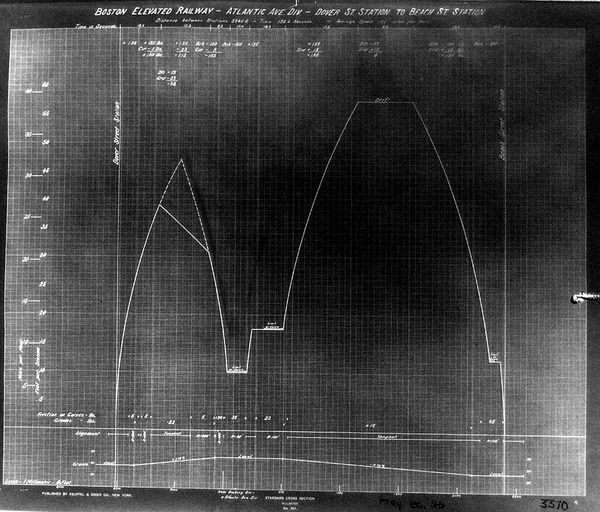
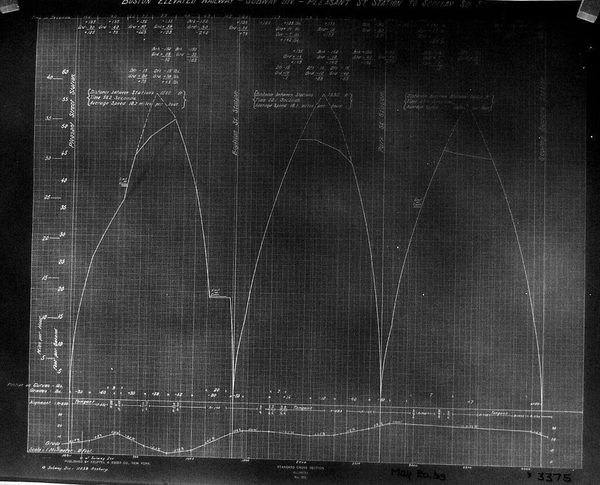
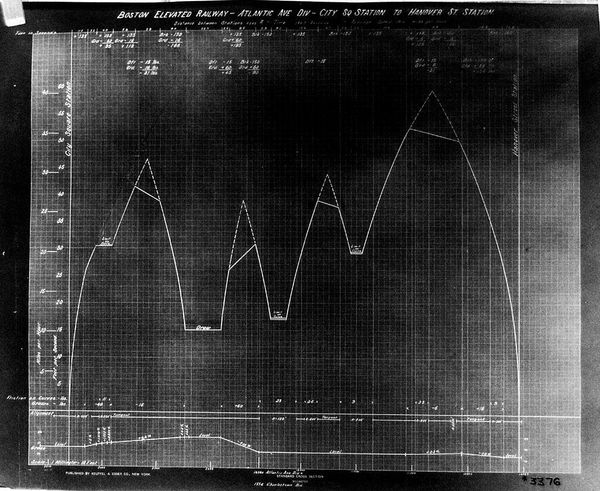
Editor: This is Paul Rowell's "Chart BERy, Charlestown Div." It looks like a technical drawing, maybe from around 1950. What can you tell me about it? Curator: This chart represents more than just engineering; it reflects the societal ambition of early 20th-century urban planning. Consider how the Boston Elevated Railway shaped communities. How did the city's elevated transit impact neighborhoods economically and socially? Editor: So, this chart wasn’t just about getting from point A to point B. It was about the broader urban experience? Curator: Exactly. It’s a document of social engineering, visualizing progress and implicitly setting the stage for urban development. Editor: That's a powerful way to see something that looks so...technical. Thanks!
Comments
No comments
Be the first to comment and join the conversation on the ultimate creative platform.
More like this